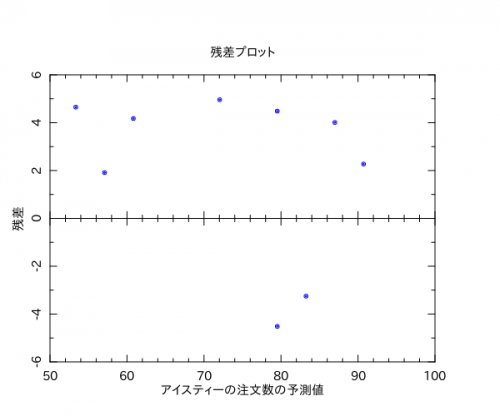
2014/06/03(火)Perl Data Language 統計編 #10 「決定係数、残差プロット、自由度調整済み決定係数、標準誤差、P値」
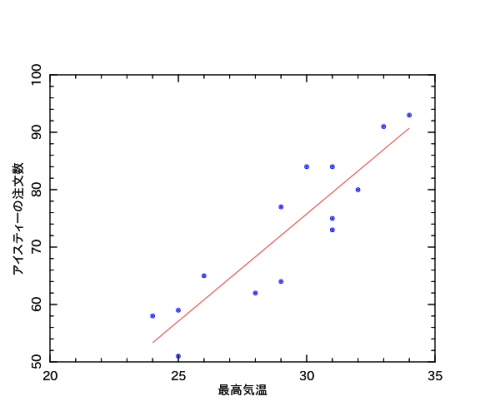
データは#09と同じく最高気温とアイスティーの注文数のデータです。
Perlで書くとこんな感じでした。
#!/usr/bin/env perl

use strict;
use warnings;
use feature qw/say/;
use PDL::Lite;
use PDL::Stats;
use PDL::Graphics::PLplot ();
use DDP filters => { -external => [ 'PDL' ] };

my $kion_max = pdl [qw/29 28 34 31 25 29 32 31 24 33 25 31 26 30/];
my $num_tea  = pdl [qw/77 62 93 84 59 64 80 75 58 91 51 73 65 84/];

my %result = $num_tea->ols($kion_max, { PLOT => 0 });

say "決定係数:";
say $result{R2}->sclr;
print "\n";

# 散布図と回帰直線の描画
my $pl = PDL::Graphics::PLplot->new(
    DEV  => 'pngcairo',
    FILE => 'manga.png',
    XLAB => '最高気温',
    YLAB => 'アイスティーの注文数',
    BOX  => [ 20, 35, 50, 100 ],
);

$pl->xyplot($kion_max, $num_tea, PLOTTYPE => 'POINTS', COLOR => 'BLUE', SYMBOLSIZE => 2);
$kion_max->qsort;
$pl->xyplot($kion_max, $result{y_pred}, PLOTTYPE => 'LINE', COLOR => 'RED');

$pl->close;

# 回帰残差の計算
my $residual = $num_tea - $result{y_pred};

# 残差プロット
my $pl2 = PDL::Graphics::PLplot->new(
    DEV        => 'pngcairo',
    FILE       => 'manga_residual.png',
    TITLE      => '残差プロット',
    PLOTTYPE   => 'POINTS',
    COLOR      => 'BLUE',
    SYMBOLSIZE => 2,
    XLAB       => 'アイスティーの注文数の予測値',
    YLAB       => '残差',
    NYSUB      => 2,
    BOX        => [ 50, 100, -6, 6 ],
    XBOX       => 'abcnst',
);

$pl2->xyplot($result{y_pred}, $residual);
$pl2->close;

my $residual_squared = $residual ** 2;

say "残差平方和:";
say $residual_squared->sum;
say $result{ss_residual}->sclr;
print "\n";

say "残差の分散:";
my $residual_variance = $result{ss_residual}->sclr / ($kion_max->nelem - 2);
say $residual_variance;
print "\n";

say "自由度調整済み決定係数:";
say 1 - ($residual_variance / $num_tea->var_unbiased);
print "\n";

say "回帰係数の標準誤差:";
say $result{b_se};
print "\n";

say "P値:";
say sprintf("%.8f", $result{b_p}->sclr);
出力↓
決定係数:
0.822509288116695

残差平方和:
391.088105726872
391.088105726872

残差の分散:
32.5906754772394

自由度調整済み決定係数:
0.807718395459753

回帰係数の標準誤差:
[0.50124814  14.687267]

P値:
0.00000766
2014/06/03(火)Perl Data Language 統計編 #09 「回帰直線を引く」
統計検定から少し寄り道して、「マンガでわかる統計学[回帰分析編]」の回帰直線を引くコードを書いていました。
最高気温とアイスティーの注文数のデータに対する回帰直線です。
一方向性の因果関係を想定する場合、散布図は、X軸に原因系の変数をとってY軸に結果系の変数をとったものにするようです。
#!/usr/bin/env perl

use strict;
use warnings;
use feature qw/say/;
use PDL::Lite;
use PDL::Stats;
use PDL::Graphics::PLplot ();
use DDP filters => { -external => [ 'PDL' ] };

my $kion_max = pdl [qw/29 28 34 31 25 29 32 31 24 33 25 31 26 30/];
my $num_tea  = pdl [qw/77 62 93 84 59 64 80 75 58 91 51 73 65 84/];

say '相関係数:' . $kion_max->corr($num_tea);

my ($a, $b) = $num_tea->ols($kion_max, { PLOT => 0 })->list;

my $pl = PDL::Graphics::PLplot->new(
    DEV  => 'pngcairo',
    FILE => 'manga.png',
    XLAB => '最高気温',
    YLAB => 'アイスティーの注文数',
    BOX  => [ 20, 35, 50, 100 ],
);

$pl->xyplot($kion_max, $num_tea, PLOTTYPE => 'POINTS', COLOR => 'BLUE', SYMBOLSIZE => 2);
$kion_max->qsort;
$pl->xyplot($kion_max, $kion_max * $a + $b, PLOTTYPE => 'LINE', COLOR => 'RED');

$pl->close;
追記: olsメソッドの戻り値のy_predに予測値が入っているので、それを使うほうが効率いいですね。戻り値はPerlのコンテキストに応じて変わります。
#!/usr/bin/env perl

use strict;
use warnings;
use PDL::Lite;
use PDL::Stats;
use PDL::Graphics::PLplot ();

my $kion_max = pdl [qw/29 28 34 31 25 29 32 31 24 33 25 31 26 30/];
my $num_tea  = pdl [qw/77 62 93 84 59 64 80 75 58 91 51 73 65 84/];

my %result = $num_tea->ols($kion_max, { PLOT => 0 });

my $pl = PDL::Graphics::PLplot->new(
    DEV  => 'xcairo',
    XLAB => '最高気温',
    YLAB => 'アイスティーの注文数',
    BOX  => [ 20, 35, 50, 100 ],
);

$pl->xyplot($kion_max, $num_tea, PLOTTYPE => 'POINTS', COLOR => 'BLUE', SYMBOLSIZE => 2);
$kion_max->qsort;
$pl->xyplot($kion_max, $result{y_pred}, PLOTTYPE => 'LINE', COLOR => 'RED');

$pl->close;
出力される図は全く同一です。
2014/06/02(月)Perl Data Language 統計編 #08 「系列相関とコレログラム」
データは↓の「第2章/本文/Salary.data」
http://www.tokyo-tosho.co.jp/download/DL02122.zip
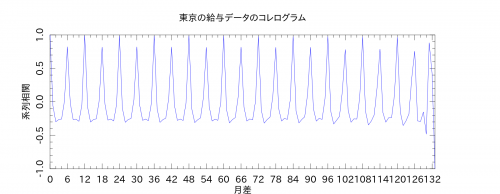
系列相関の式を見るだけでは分かりづらいので、PDLで計算&グラフ描画です。
実行にも時間がかかるようになってきましたが、計算結果をハッシュとかでメモするなどの高速化の余地はあります。
#!/usr/bin/env perl

use strict;
use warnings;
use feature qw/say/;
use PDL::Lite;
use PDL::IO::Misc ();
use PDL::Graphics::PLplot ();
use DDP filters => { -external => [ 'PDL' ] };

my $infile       = 'Salary.data';
my $colnum_time  = 0;
my $colnum_tokyo = 2;

my ($yyyymm, $salary) = PDL->rcols($infile, { COLSEP => "t", INCLUDE => qr/[0-9]/ }, $colnum_time, $colnum_tokyo);

my $T = $yyyymm->nelem;
my $X = pdl [ 0 .. $T - 2 ]; # 月差
my $Y = PDL->null;           # 系列相関

for my $h (0 .. $T - 2)
{
    my $hensa_sekiwa = 0;
    my $s_h          = 0;
    my $s_plus_h     = 0;

    for my $i ( 0 .. ($T - 1) - $h )
    {
        my $y_bar_h      = 0;
        my $y_bar_plus_h = 0;

        for my $j ( 0 .. ($T - 1) - $h )
        {
            $y_bar_h      += $salary->at($j)    / ($T - $h);
            $y_bar_plus_h += $salary->at($j+$h) / ($T - $h);
        }

        $s_h      += ($salary->at($i) - $y_bar_h) ** 2;
        $s_plus_h += ($salary->at($i+$h) - $y_bar_plus_h) ** 2;

        $hensa_sekiwa += ($salary->at($i) - $y_bar_h) * ($salary->at($i+$h) - $y_bar_plus_h);
    }

    $s_h      = sqrt $s_h;
    $s_plus_h = sqrt $s_plus_h;

    my $r_h = $hensa_sekiwa / ($s_h * $s_plus_h);
    $Y = $Y->append($r_h);

    say $r_h;
}

my $pl = PDL::Graphics::PLplot->new(
    DEV      => 'pngcairo',
    FILE     => 'correlogram.png',
    PAGESIZE => [1800, 700],
    TITLE    => '東京の給与データのコレログラム',
    COLOR    => 'BLUE',
    XLAB     => '月差',
    XTICK    => 6,
    NXSUB    => 3,
    YLAB     => '系列相関',
);

$pl->xyplot($X, $Y);
$pl->close;
統計検定のテキストによると、縦軸を系列相関、横軸を時間差にしたものをコレログラムというらしい。テキスト通り、6ヶ月差と12ヶ月差で周期性が見られました。
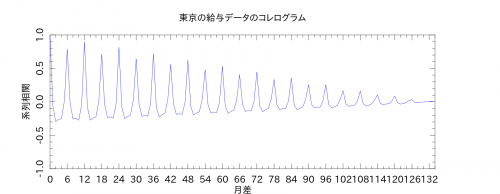
ちなみに、「PDL::Stats」のメソッドでやると↓のようになりました。系列相関係数の定義式が本によって違うんだけど、とりあえず統計検定2級のテキストに従っておけばいいのだろうか。
#!/usr/bin/env perl

use strict;
use warnings;
use feature qw/say/;
use PDL::Lite;
use PDL::Stats;
use PDL::IO::Misc ();
use PDL::Graphics::PLplot ();
use DDP filters => { -external => [ 'PDL' ] };

my $infile       = 'Salary.data';
my $colnum_time  = 0;
my $colnum_tokyo = 2;

my ($yyyymm, $salary) = PDL->rcols($infile, { COLSEP => "t", INCLUDE => qr/[0-9]/ }, $colnum_time, $colnum_tokyo);

my $X = pdl [ 0 .. $yyyymm->nelem - 1 ]; # 月差
my $Y = $salary->acf;

my $pl = PDL::Graphics::PLplot->new(
    DEV      => 'pngcairo',
    FILE     => 'correlogram.png',
    PAGESIZE => [1800, 700],
    TITLE    => '東京の給与データのコレログラム',
    COLOR    => 'BLUE',
    XLAB     => '月差',
    XTICK    => 6,
    NXSUB    => 3,
    YLAB     => '系列相関',
    BOX      => [ $X->minmax,  -1.0, 1.0 ],
);

$pl->xyplot($X, $Y);
$pl->close;
2014/05/30(金)Perl Data Language 統計編 #07 「標準化(Z)得点、偏差値(T)得点、変動係数、(やらしい)散布図、相関係数」
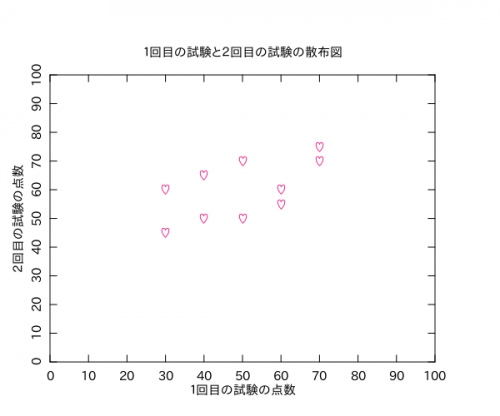
10人の2回の試験結果の分析です。
PLplotでどうやって散布図書くのかと思ったけど、PLOTTYPEをPOINTSに変えれば散布図になりました。使えるSYMBOLは「http://search.cpan.org/~dhunt/PDL-Graphics-PLplot-0.67/plplot.pd#SYMBOL」を参照。適当にハートマークのプロットの散布図にしてみました(謎)。
コードはループ中にavgメソッドがあったりとあまり効率よくなさそうですが、短く書くのを優先しました。(おそらく平均とかは別の変数に格納しておくほうが速いと思われる)
相関係数は「PDL::Stats」はN-1じゃないほうで計算しているけど、相関係数の定義式ではNでもN-1でも分母分子はNまたはN-1が割って1になるため、この違いは関係なくなります。
相関係数はおよそ0.6で、ぼちぼち相関ありって感じです。
#!/usr/bin/env perl

use strict;
use warnings;
use feature qw/say/;
use PDL::Lite;
use PDL::Stats;
use PDL::IO::Misc ();
use PDL::Graphics::PLplot ();
use DDP filters => { -external => [ 'PDL' ] };

# 試験結果
# Aさん .. Jさんの順番で並んでいる
my $first  = pdl [qw/30 30 40 40 50 50 60 60 70 70/];
my $second = pdl [qw/45 60 50 65 70 50 55 60 70 75/];

say "1回目の試験の平均  :" . sprintf("%.1f", $first->avg);
say "1回目の試験の標準偏差:" . sprintf("%.1f", $first->stdv_unbiased);
say "2回目の試験の平均  :" . sprintf("%.1f", $second->avg);
say "2回目の試験の標準偏差:" . sprintf("%.1f", $second->stdv_unbiased);
print "\n";

# 標準化
my $first_standardized  = ($first  - $first->avg)  / $first->stdv_unbiased;
my $second_standardized = ($second - $second->avg) / $second->stdv_unbiased;

say "Cさんの1回目と2回目の標準化(Z)得点:";
my $c_san_num = 2;
printf( "%.2f", $first_standardized->at($c_san_num) );
print " ";
printf( "%.2f", $second_standardized->at($c_san_num) );
print "\n";
print "\n";

say "みんなの偏差値(T得点):";
my $first_t  = $first_standardized  * 10 + 50;
my $second_t = $second_standardized * 10 + 50;
say "1回目:";
printf("%.1f ", $_) for $first_t->list;
print "n";
say "2回目:";
printf("%.1f ", $_) for $second_t->list;
print "\n";
print "\n";

say "1回目の変動係数:" . $first->stdv_unbiased  / $first->avg;
say "2回目の変動係数:" . $second->stdv_unbiased / $second->avg;
print "\n";

say "1回目の試験と2回目の試験の相関係数:";
say sprintf( "%.3f", $first->corr($second) );

# 一応、専用メソッドを使わずに相関係数を求めてみる
my $sxy = 0;

for my $i ($first->listindices)
{
    $sxy += ($first->at($i) - $first->avg) * ($second->at($i) - $second->avg);
}

$sxy /= $first->nelem - 1;

say sprintf( "%.3f", $sxy / ($first->stdv_unbiased * $second->stdv_unbiased) );

my $pl = PDL::Graphics::PLplot->new(
    DEV        => 'xcairo',
    TITLE      => '1回目の試験と2回目の試験の散布図',
    XLAB       => '1回目の試験の点数',
    XTICK      => 10,
    NXSUB      => 1,
    YLAB       => '2回目の試験の点数',
    YTICK      => 10,
    NYSUB      => 1,
    COLOR      => 'DEEPPINK',
    PLOTTYPE   => 'POINTS',
    SYMBOL     => 742, # ハートマーク
    SYMBOLSIZE => 1.5,
);

$pl->xyplot($first, $second, BOX => [ 0, 100, 0, 100 ]);
$pl->close;
1回目の試験の平均  :50.0
1回目の試験の標準偏差:14.9
2回目の試験の平均  :60.0
2回目の試験の標準偏差:10.0

Cさんの1回目と2回目の標準化(Z)得点:
-0.67 -1.00

みんなの偏差値(T得点):
1回目:
36.6 36.6 43.3 43.3 50.0 50.0 56.7 56.7 63.4 63.4
2回目:
35.0 50.0 40.0 55.0 60.0 40.0 45.0 50.0 60.0 65.0

1回目の変動係数:0.298142396999972
2回目の変動係数:0.166666666666667

1回目の試験と2回目の試験の相関係数:
0.596
0.596
2014/05/30(金)Perl Data Language 統計編 #06 「時系列データの折れ線グラフ」
データ↓
http://www.tokyo-tosho.co.jp/download/DL02122.zip
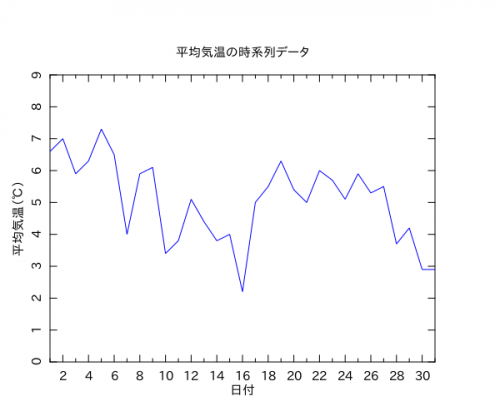
問1.1の7)は平均気温の変化を時系列データとして折れ線グラフで描けという問題。これは瞬殺できる問題ですな。
#!/usr/bin/env perl

use strict;
use warnings;
use PDL::Lite;
use PDL::IO::Misc ();
use PDL::Graphics::PLplot;
use DDP filters => { -external => [ 'PDL' ] };

my $infile        = 'weather.csv';
my $colnum_hizuke = 0;
my $colnum_kion   = 1;

my ($hizuke, $heikin_kion) = PDL->rcols($infile, { COLSEP => ',', INCLUDE => qr/[0-9]/ }, $colnum_hizuke, $colnum_kion);

my $pl = PDL::Graphics::PLplot->new(
    DEV   => 'xcairo',
    TITLE => '平均気温の時系列データ',
    XLAB  => '日付',
    XTICK => 2,
    NXSUB => 2,
    YLAB  => '平均気温(℃)',
    YTICK => 1,
    NYSUB => 1,
    COLOR => 'BLUE',
);

$pl->xyplot($hizuke, $heikin_kion, BOX => [ $hizuke->minmax, 0, int($heikin_kion->max) + 2 ]);
$pl->close;
