2014/06/03(火)Perl Data Language 統計編 #09 「回帰直線を引く」
統計検定から少し寄り道して、「マンガでわかる統計学[回帰分析編]」の回帰直線を引くコードを書いていました。
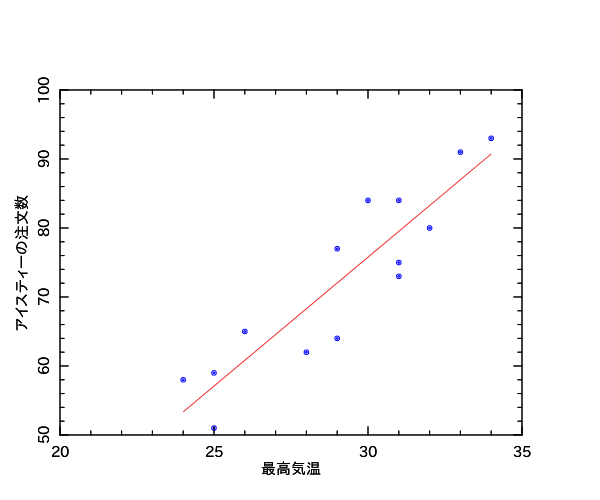
最高気温とアイスティーの注文数のデータに対する回帰直線です。
一方向性の因果関係を想定する場合、散布図は、X軸に原因系の変数をとってY軸に結果系の変数をとったものにするようです。
#!/usr/bin/env perl

use strict;
use warnings;
use feature qw/say/;
use PDL::Lite;
use PDL::Stats;
use PDL::Graphics::PLplot ();
use DDP filters => { -external => [ 'PDL' ] };

my $kion_max = pdl [qw/29 28 34 31 25 29 32 31 24 33 25 31 26 30/];
my $num_tea  = pdl [qw/77 62 93 84 59 64 80 75 58 91 51 73 65 84/];

say '相関係数:' . $kion_max->corr($num_tea);

my ($a, $b) = $num_tea->ols($kion_max, { PLOT => 0 })->list;

my $pl = PDL::Graphics::PLplot->new(
    DEV  => 'pngcairo',
    FILE => 'manga.png',
    XLAB => '最高気温',
    YLAB => 'アイスティーの注文数',
    BOX  => [ 20, 35, 50, 100 ],
);

$pl->xyplot($kion_max, $num_tea, PLOTTYPE => 'POINTS', COLOR => 'BLUE', SYMBOLSIZE => 2);
$kion_max->qsort;
$pl->xyplot($kion_max, $kion_max * $a + $b, PLOTTYPE => 'LINE', COLOR => 'RED');

$pl->close;
追記: olsメソッドの戻り値のy_predに予測値が入っているので、それを使うほうが効率いいですね。戻り値はPerlのコンテキストに応じて変わります。
#!/usr/bin/env perl

use strict;
use warnings;
use PDL::Lite;
use PDL::Stats;
use PDL::Graphics::PLplot ();

my $kion_max = pdl [qw/29 28 34 31 25 29 32 31 24 33 25 31 26 30/];
my $num_tea  = pdl [qw/77 62 93 84 59 64 80 75 58 91 51 73 65 84/];

my %result = $num_tea->ols($kion_max, { PLOT => 0 });

my $pl = PDL::Graphics::PLplot->new(
    DEV  => 'xcairo',
    XLAB => '最高気温',
    YLAB => 'アイスティーの注文数',
    BOX  => [ 20, 35, 50, 100 ],
);

$pl->xyplot($kion_max, $num_tea, PLOTTYPE => 'POINTS', COLOR => 'BLUE', SYMBOLSIZE => 2);
$kion_max->qsort;
$pl->xyplot($kion_max, $result{y_pred}, PLOTTYPE => 'LINE', COLOR => 'RED');

$pl->close;
出力される図は全く同一です。