2014/06/03(火)Perl Data Language 統計編 #10 「決定係数、残差プロット、自由度調整済み決定係数、標準誤差、P値」
データは#09と同じく最高気温とアイスティーの注文数のデータです。
Perlで書くとこんな感じでした。
#!/usr/bin/env perl

use strict;
use warnings;
use feature qw/say/;
use PDL::Lite;
use PDL::Stats;
use PDL::Graphics::PLplot ();
use DDP filters => { -external => [ 'PDL' ] };

my $kion_max = pdl [qw/29 28 34 31 25 29 32 31 24 33 25 31 26 30/];
my $num_tea  = pdl [qw/77 62 93 84 59 64 80 75 58 91 51 73 65 84/];

my %result = $num_tea->ols($kion_max, { PLOT => 0 });

say "決定係数:";
say $result{R2}->sclr;
print "\n";

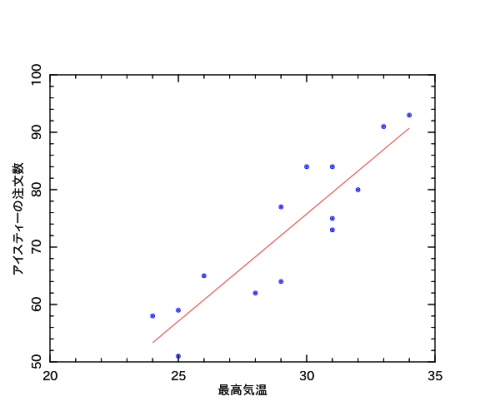
# 散布図と回帰直線の描画
my $pl = PDL::Graphics::PLplot->new(
    DEV  => 'pngcairo',
    FILE => 'manga.png',
    XLAB => '最高気温',
    YLAB => 'アイスティーの注文数',
    BOX  => [ 20, 35, 50, 100 ],
);

$pl->xyplot($kion_max, $num_tea, PLOTTYPE => 'POINTS', COLOR => 'BLUE', SYMBOLSIZE => 2);
$kion_max->qsort;
$pl->xyplot($kion_max, $result{y_pred}, PLOTTYPE => 'LINE', COLOR => 'RED');

$pl->close;

# 回帰残差の計算
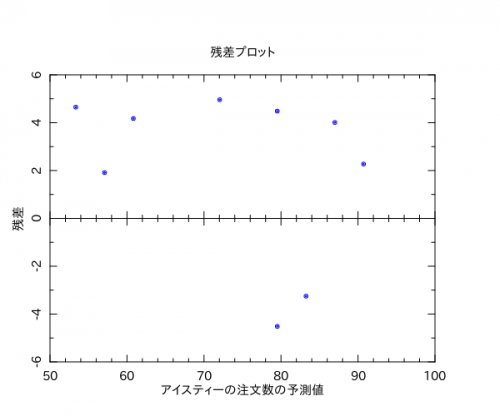
my $residual = $num_tea - $result{y_pred};

# 残差プロット
my $pl2 = PDL::Graphics::PLplot->new(
    DEV        => 'pngcairo',
    FILE       => 'manga_residual.png',
    TITLE      => '残差プロット',
    PLOTTYPE   => 'POINTS',
    COLOR      => 'BLUE',
    SYMBOLSIZE => 2,
    XLAB       => 'アイスティーの注文数の予測値',
    YLAB       => '残差',
    NYSUB      => 2,
    BOX        => [ 50, 100, -6, 6 ],
    XBOX       => 'abcnst',
);

$pl2->xyplot($result{y_pred}, $residual);
$pl2->close;

my $residual_squared = $residual ** 2;

say "残差平方和:";
say $residual_squared->sum;
say $result{ss_residual}->sclr;
print "\n";

say "残差の分散:";
my $residual_variance = $result{ss_residual}->sclr / ($kion_max->nelem - 2);
say $residual_variance;
print "\n";

say "自由度調整済み決定係数:";
say 1 - ($residual_variance / $num_tea->var_unbiased);
print "\n";

say "回帰係数の標準誤差:";
say $result{b_se};
print "\n";

say "P値:";
say sprintf("%.8f", $result{b_p}->sclr);
出力↓
決定係数:
0.822509288116695

残差平方和:
391.088105726872
391.088105726872

残差の分散:
32.5906754772394

自由度調整済み決定係数:
0.807718395459753

回帰係数の標準誤差:
[0.50124814  14.687267]

P値:
0.00000766

