2014/05/29(木)Perl Data Language 統計編 #03 「累積相対度数グラフ」
データ↓
http://www.tokyo-tosho.co.jp/download/DL02122.zip
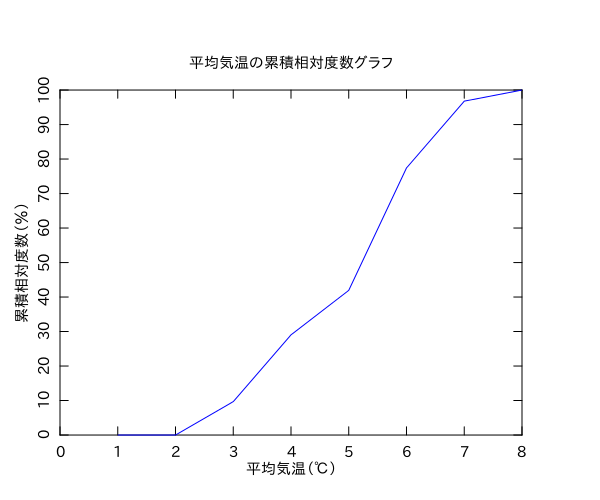
問1.1の4)はPDL::IO::Misc::rcols でCSVファイルから平均気温のデータのとこだけ抜き出して、相対度数を計算してグラフに出力という流れです。
#!/usr/bin/env perl

use strict;
use warnings;
use feature qw/say/;
use PDL::Lite;
use PDL::IO::Misc ();
use PDL::Graphics::PLplot;
use DDP filters => { -external => [ 'PDL' ] };

my $infile = 'weather.csv';
my $colnum = 1;
my $heikin_kion_list = PDL->rcols($infile, { COLSEP => ',', INCLUDE => '/[0-9]/' }, $colnum);

my $kion_list = pdl [ int($heikin_kion_list->min) - 1 .. int($heikin_kion_list->max) + 1 ];

my $num_elem = $heikin_kion_list->nelem;
my @sotai_freq_list;

for my $kion ($kion_list->list)
{
    my $sotai_freq = $heikin_kion_list->where($heikin_kion_list <= $kion)->nelem / $num_elem * 100;
    push(@sotai_freq_list, $sotai_freq);
}

my $pl = PDL::Graphics::PLplot->new(
    DEV   => 'xcairo',
    TITLE => '平均気温の累積相対度数グラフ',
    XLAB  => '平均気温(℃)',
    YLAB  => '累積相対度数(%)',
    XTICK => 1,
    NXSUB => 1,
    YTICK => 10,
    NYSUB => 1,
    COLOR => 'BLUE',
);

my $sotai_freq_list = pdl @sotai_freq_list;

$pl->xyplot($kion_list, $sotai_freq_list, BOX => [ 0, $kion_list->max, 0, 100 ]);
$pl->close;